The largest cryptocurrency Bitcoin is underperforming nowadays. In the past several weeks, investors saw a profitable journey as the BTC price reversed from the two-year bottom. But again uncertainty remains in the market as per the price action.
At the time of writing, the Bitcoin price against USDT trades at $20,000. The market capitalization dramatically plumped by 8.16% in the last 24 hours and was recorded at $386 billion.
BTC Price on 4-Hour Chart

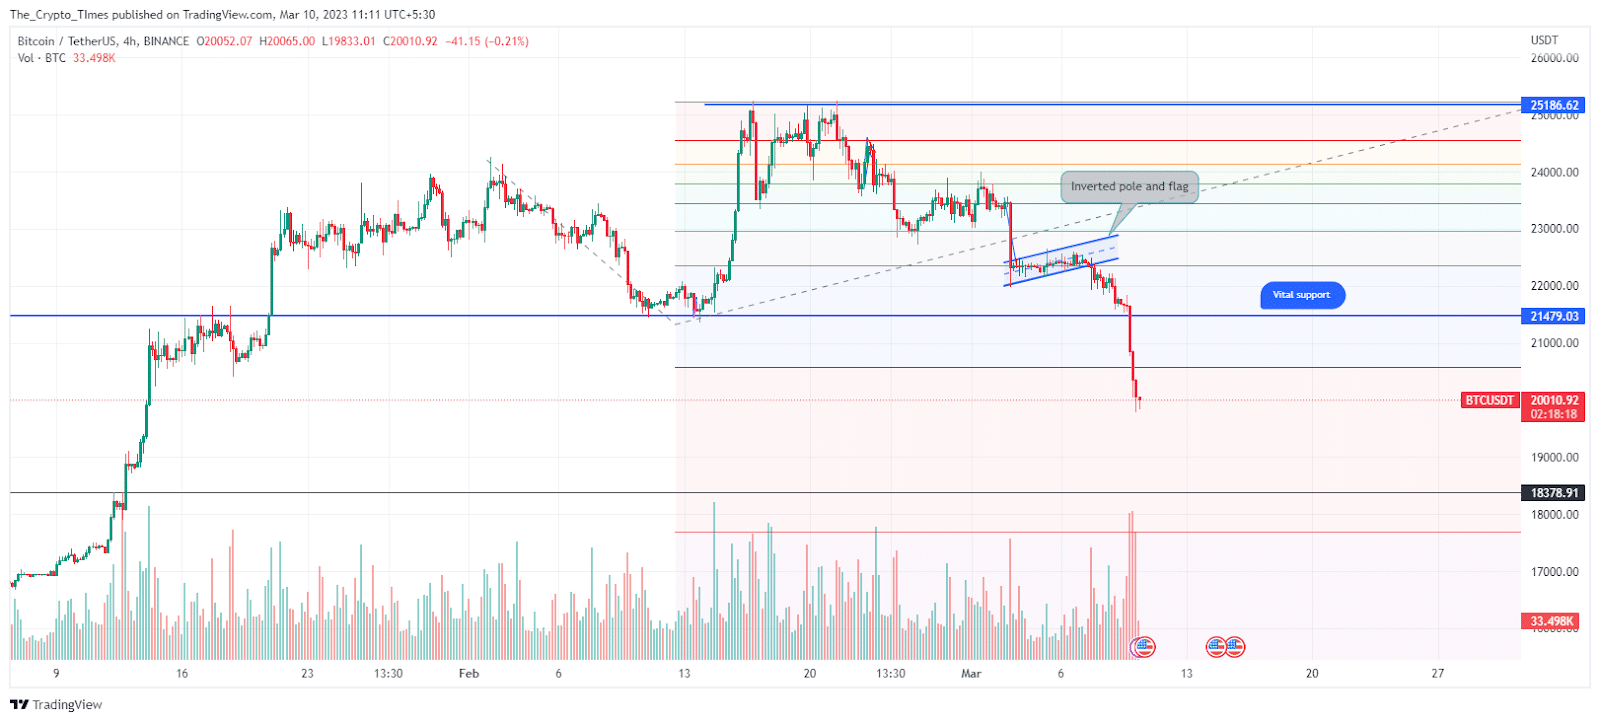
We can see from the chart that Bitcoin price continuously slipped from the yearly high of $25,250. The bears have barely defended the $25,000 selling zone multiple times. Meanwhile, speculators are following the selling-on-top strategy and this downtrend may rest at $19,000 if BTC moves lower than the $20,000 mark.
In the recent bounce, the price structure drew an inverted pole and flag pattern. The breakdown of this bearish price structure brought an incredible opportunity for market sellers. Resulting in bears gaining more than 10% gain in the past seven days as per CoinMarketCap.
It appears buyers have lost dominance on Bitcoin, and this correction phase has turned into a downtrend as per aggressive selling and a 45-day vital support level ($21,500) breakdown.
BTC on Daily Price Chart

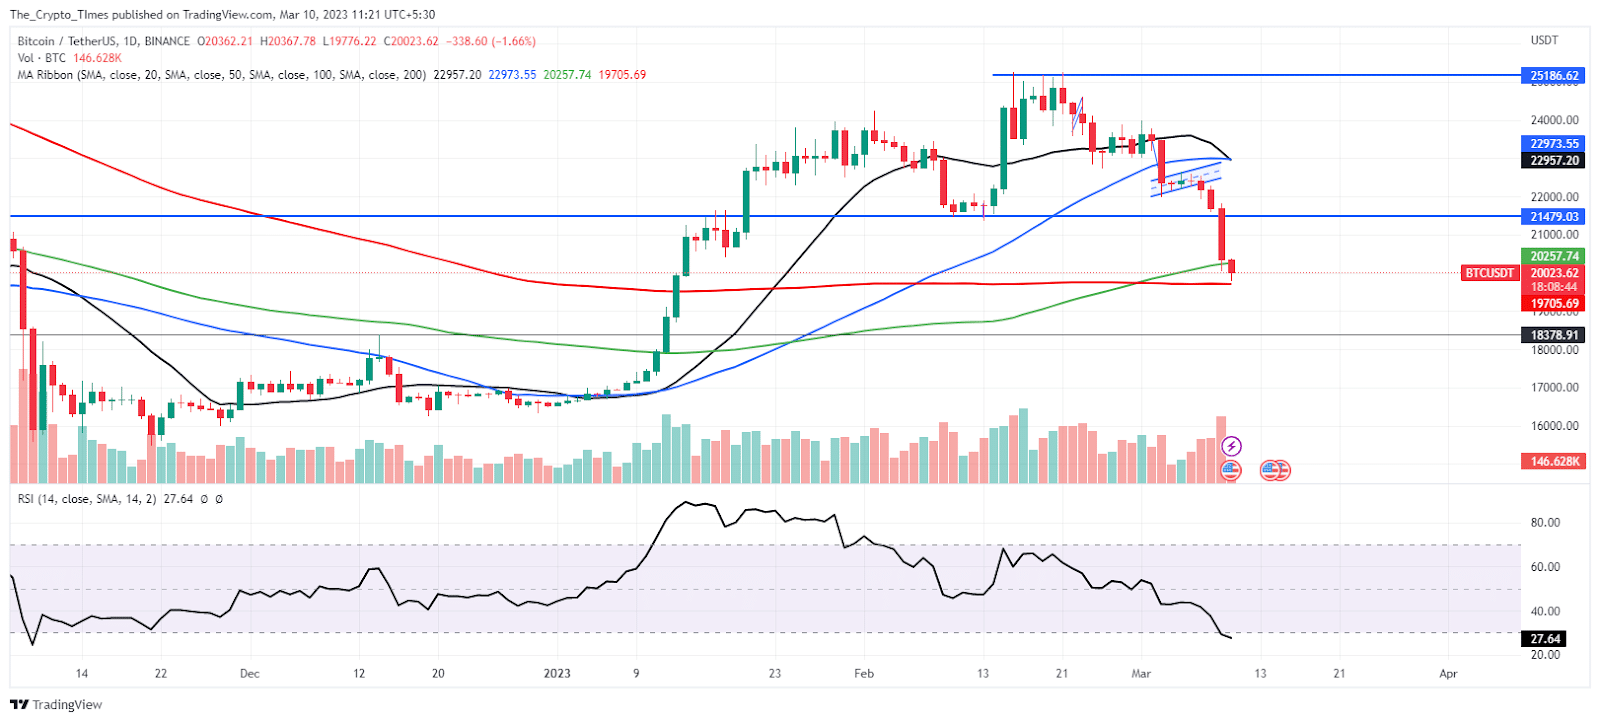
On the daily price chart, bitcoin price is trading below the 20 and 50-day moving averages. Thus, yesterday’s aggressive decline pushed the bitcoin price toward the 200 SMA. The 200 SMA (red) seems to be the last save zone for the buyers. Below this level, BTC could trade down to $18,400 before any significant rally.
Notably, trading volume spiked higher by 64% overnight and reached $36 billion. The trading volume shows intense selling in BTC. Additionally, the daily RSI entered into extremely oversold territory. And any bounceback in RSI could lead to a BTC recovery, so this could be a good buying opportunity.
Also read: Silvergate Uncertainty Wipeout Bitcoin’s $20 Billion Market Cap


