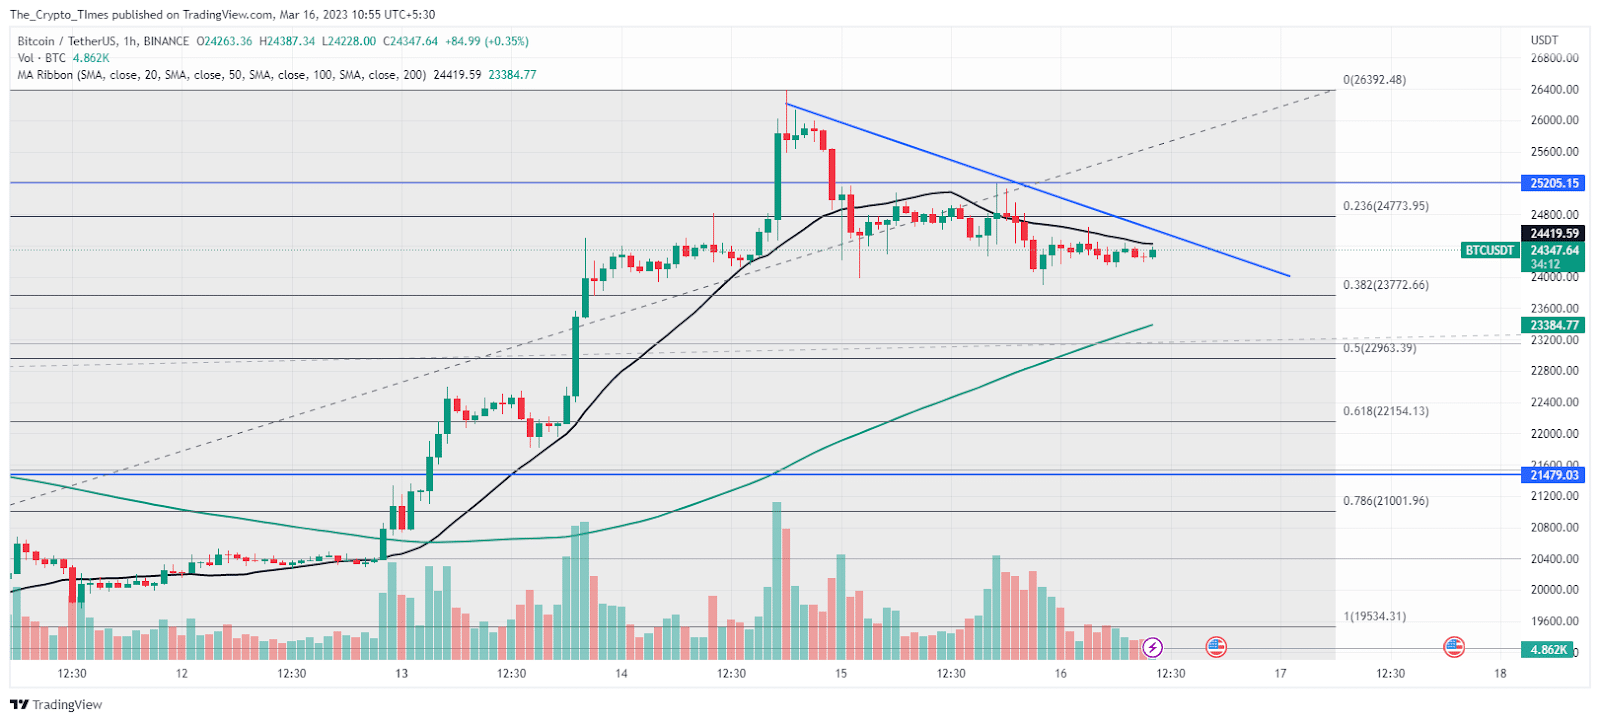
Bitcoin price has breached the previous 2023 high and noted a new high at $26,386 on Tuesday, but bulls failed to maintain this region, and the price decreased.
After recording a yearly high, bears started dumping Bitcoin, and so far, they have trimmed nearly 8% cost. Meanwhile, the Bitcoin price against the USDT pair hovers at $24,420 at press time.
Is this the Inflation zone of BTC?

The bears appear to be aggressive near the supply zone ($25,200 to $26,000) on the hourly chart. As per the price action, bears linked all these highs and form a descending trend line making a resistance.
The descending trend line (blue) signals more downside unless bulls breach its upside with an aggressive buying force. As of now, the bears are keeping BTC below the 20-hour SMA (black).
Bitcoin price looks sideways as it trading between $24,000 and $24,500. The 100 hourly moving average is still below the current prices, and the retracement might be halted.
The expected retracement phase kept the price near the 0.382 Fibonacci retracement level, and the next momentum is expected when buyers surpass BTC from the downside.

As per CoinMarketCap, the trading volume fell by 21% overnight due to a lack of volatility, and the market capitalization remained neutral at $473.5 billion at the time.
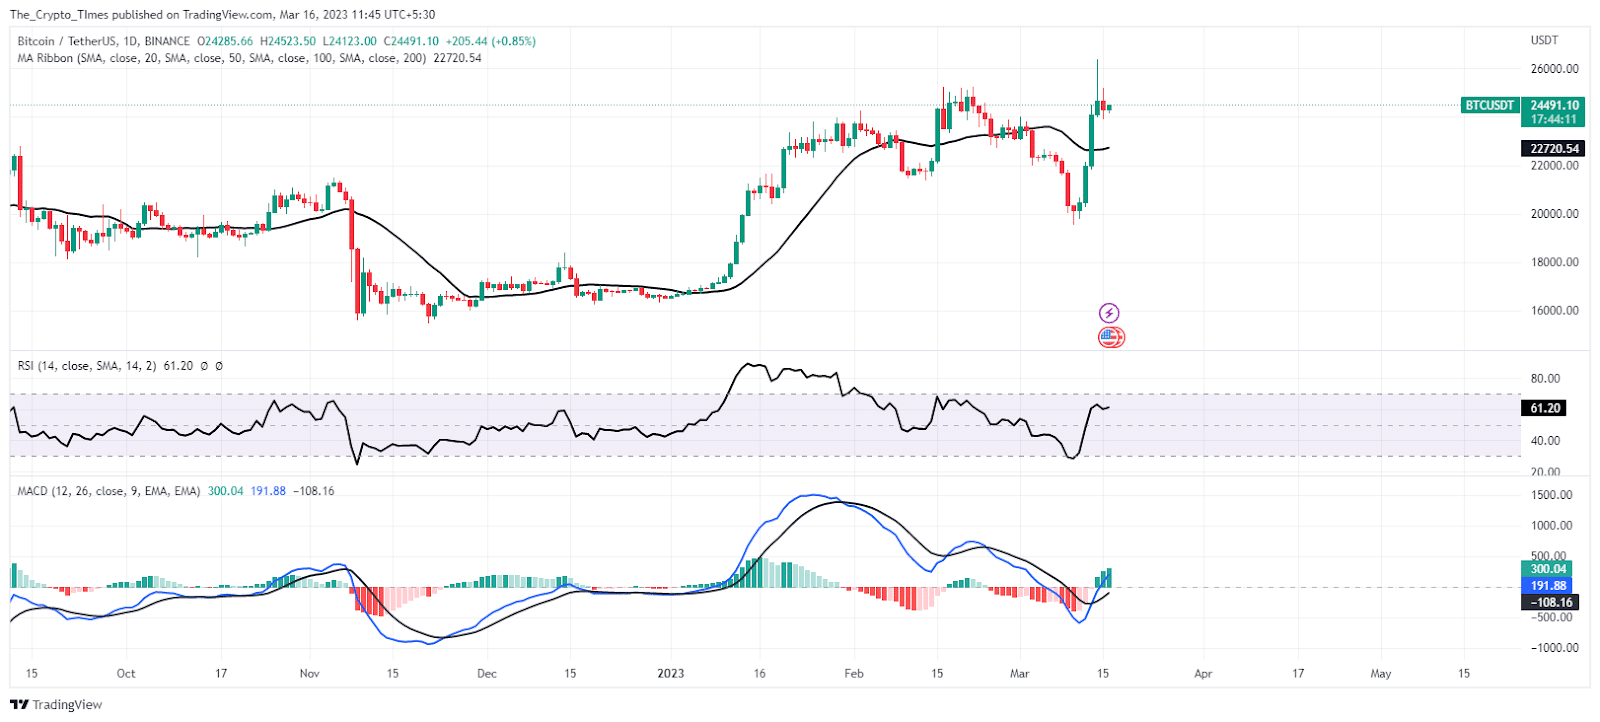
Even though the downtrend in Bitcoin price turns sideways, the 20 daily EMA remains an important defending level for the bulls.
The daily RSI is holding steady at 60 after falling into the oversold zone.
The Moving Average Convergence Divergence (MACD) indicator is moving in a positive direction and is showing a buying potential if the histogram is rising.
Technical Levels:
- Resistance Level – $25,200 and $26,386
- Support Levels – $23,800 and $22,500
Subscribe to The Crypto Times for more Crypto Analysis !!


