Bitcoin has displayed an encouraging upward trend in its price, indicating positive momentum following a recent low point that lasted for a span of 60 days. Analysts are projecting BTC may retest the $30,000k in its next upwards move.
During shorter time periods, Bitcoin has demonstrated a bullish price pattern preceding rapid gains, acting as a motivating factor for those in favour of a bullish market.
During this week, the price of Bitcoin has successfully surpassed the $28,000 mark, experiencing a noteworthy weekly gain of 4.92% against the USD pair.
The macroeconomic data from the United States for the week concluded with an unexpected development, as the newly released Personal Consumption Expenditures (PCE) index indicated that the economy was handling tighter financial conditions more effectively than anticipated.
Consequently, the market responded by factoring in the likelihood of an interest rate hike by the Federal Reserve in June. Such a move typically poses challenges for risk assets; however, it did not hinder the rebound of Bitcoin‘s price.
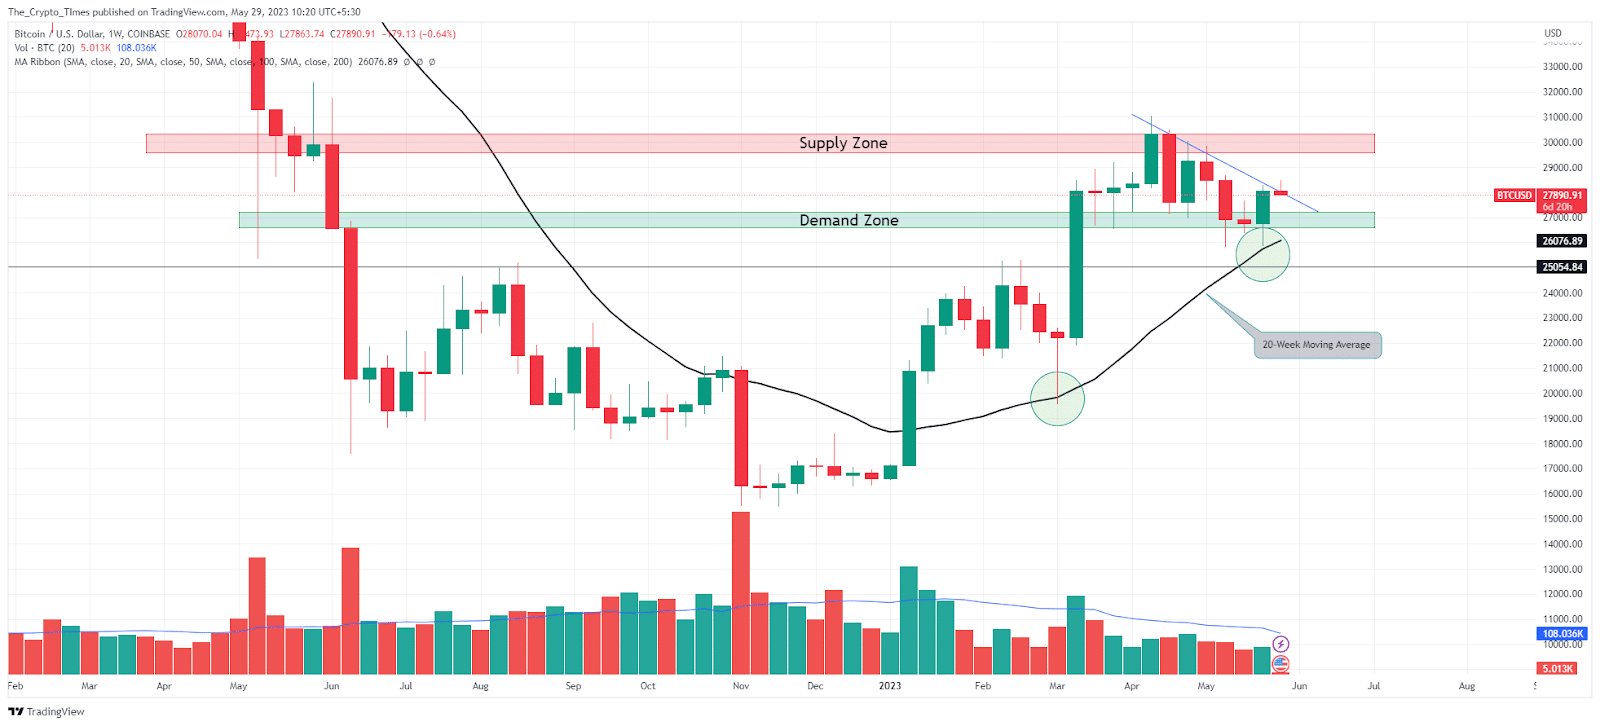
Bitcoin Price Stays Firmly Above 20-Week SMA

Over the past four months, the price of Bitcoin (BTC) on the weekly chart has discovered support at the 20-week simple moving average on two occasions. Despite some limited efforts from sellers, they were unable to sustain enough selling pressure to keep the price below the demand zone.
Currently, the trading volume appears to be relatively neutral in comparison to previous weeks. However, the recent bullish obstacle could potentially disrupt the current momentum.

As of the time of composing this response, the price of Bitcoin (BTC) stands at $28,000, reflecting an overnight gain of 3.10%. Notably, trading volume has experienced a significant surge, increasing by 70% in the past 24 hours to reach $15.9 billion, as reported by CoinMarketCap data.
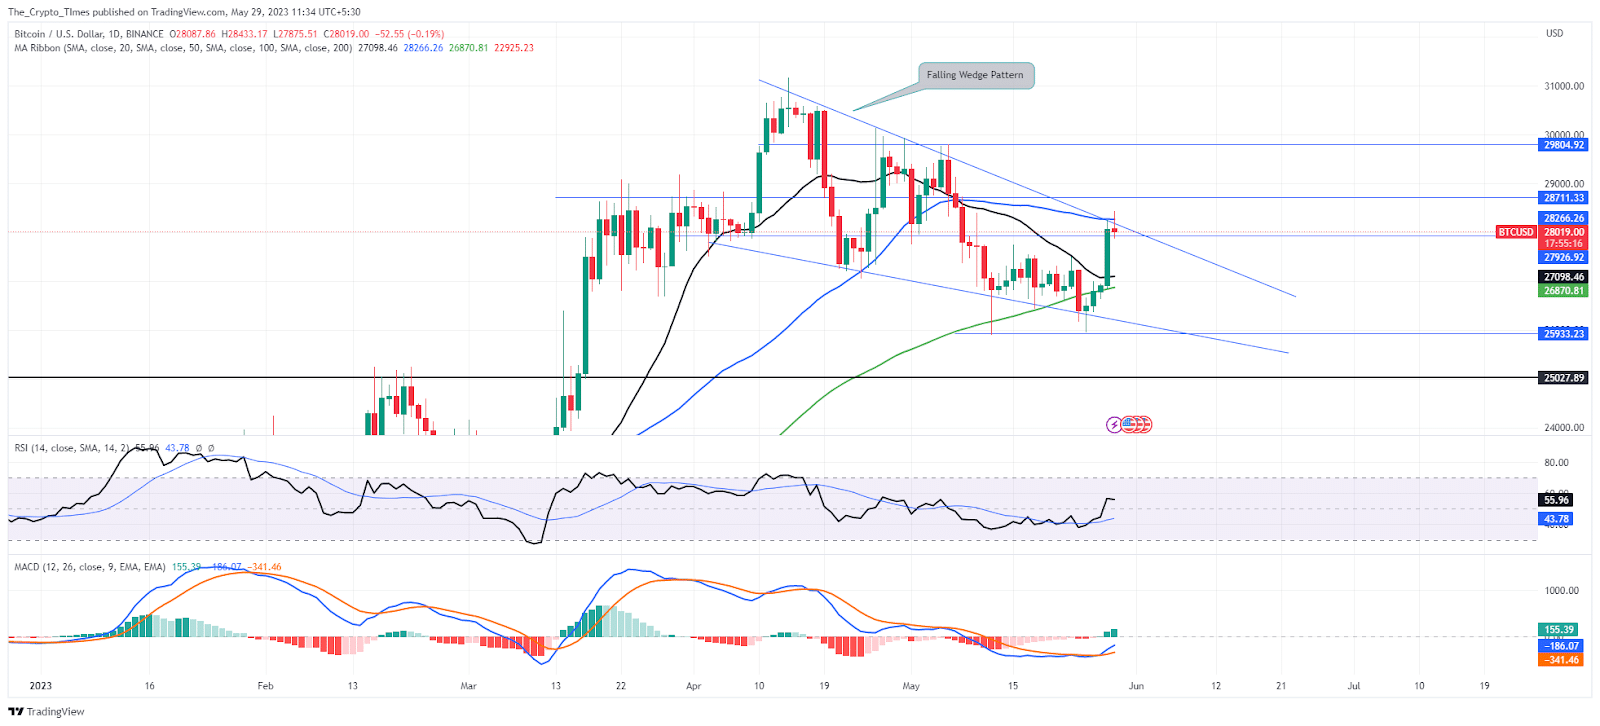
Around the $26,000 mark, a double bottom formation took shape in the price structure, paving the way for a subsequent rebound. This particular price pattern acted as a catalyst, propelling the price to surge by over 9.5% within the span of the last five trading sessions. The price climbed from $25,948 to $28,433, reflecting the impact of this pattern on market dynamics.
At present, the bulls are making strides towards overcoming a significant bullish challenge in the form of a falling wedge pattern and the 50-day simple moving average (SMA). Should they successfully surpass these two bullish obstacles, it is likely that the bulls will trigger a rally of approximately 2000 points, propelling the price toward the key resistance level of $30,000.
The daily RSI is currently holding steady within the range of 55, which suggests a positive indication. Conversely, the Moving Average Convergence Divergence (MACD) is still situated in the negative region; however, it has recently produced a bullish crossover.
Also Read: IMF Optimism Amid Central African Bitcoin Adoption


