This week, the Hedera blockchain celebrated a major achievement by surpassing the impressive milestone of 10 billion transactions. However, despite this momentous news, the native cryptocurrency HBAR appeared to lack the desired boost in excitement and activity.
A recent analysis conducted by Messari delved into the network activity of Hedera during Q1 2023. Notably, the quarter witnessed an astounding 170% surge in daily active addresses, representing the highest address growth ever recorded in Hedera’s history. Consequently, signaling the remarkable momentum and expansion of the network.
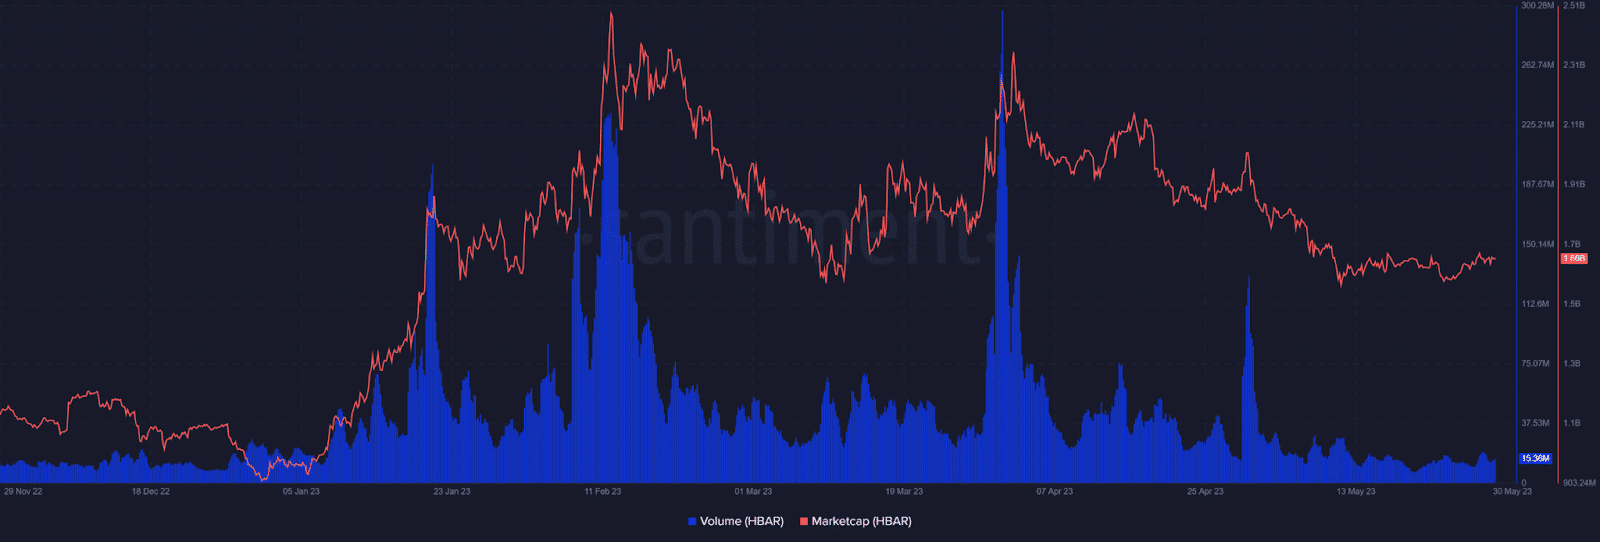
The remarkable growth in Hedera’s network activity coincided with substantial increases in volume during both January and March. This influx of liquidity into the network had a positive impact on Hedera’s market capitalization, showcasing the market’s recognition of its potential and value.
Hedera’s market cap sits at $1.61 billion, yet an intriguing trend emerged as the April volume peak didn’t reach the market cap peak seen in February. This dynamic underscores the complex factors influencing Hedera’s valuation throughout the year.
Similarly, on March 9th, the Hedera mainnet achieved a noteworthy milestone by surpassing 5 billion transactions, even though the platform experienced an incident of exploitation in its Smart Contract Services code on the same day.

According to the Santiment data, the February peak saw significant whale activity, while the second peak was driven primarily by retail buyers. Since then, the market cap has gradually decreased. Similarly, Hedera’s on-chain volume have been a fraction of what was observed between January and April.

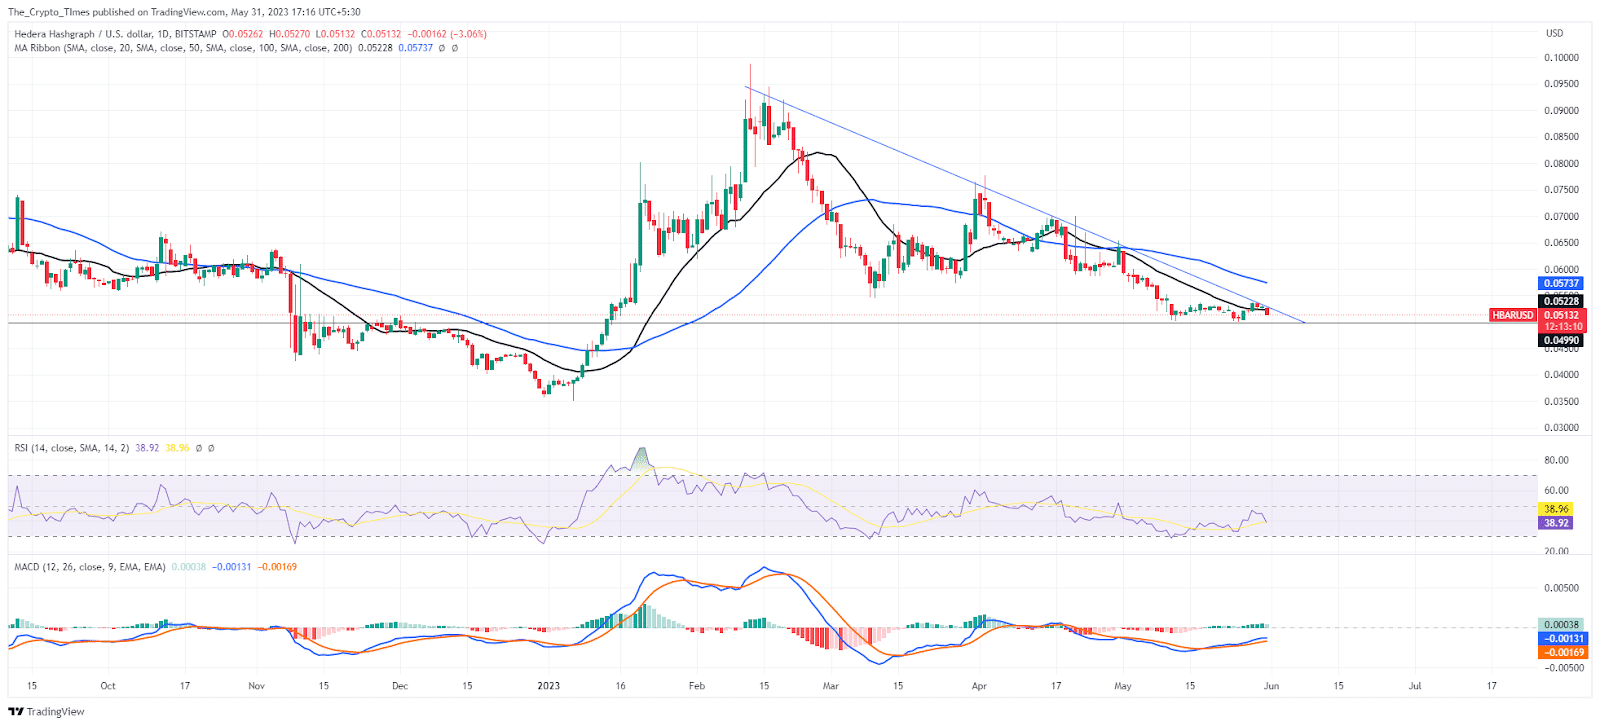
Despite reaching a significant milestone in transactions, the price of Hedera (HBAR) has been underperforming since its annual high of $0.098. The cryptocurrency has retraced over 50% thus far, with the current price at $0.0512 at press time.
The price of HBAR has been persistently below both the 20-day and 50-day simple moving averages, indicating prevailing selling pressure. Key technical indicators, such as RSI and MACD, further reinforce the dominance of bears in the market.


