
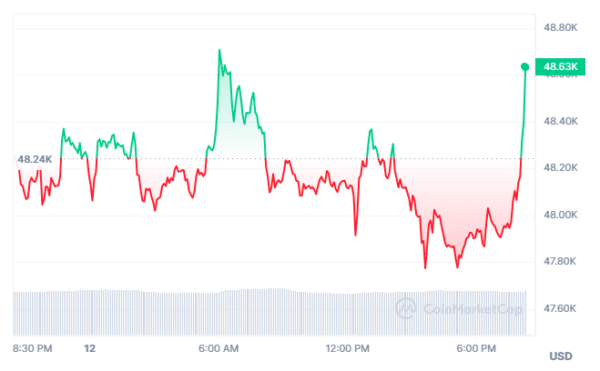
The price of the largest cryptocurrency, Bitcoin surged to $48,707 on Sunday, reaching a market value of $941 billion, with a trading volume of $19.81 billion on Monday. Currently, it is trading at $48,618, according to data from CoinMarketCap.
Analyzing the 1-hour chart reveals market indecision, offering potential entry and exit points based on emerging patterns. The 4-hour perspective suggests a slowing bullish momentum, signaling likely consolidation or retracement.
Bitcoin’s breach of the 11.50% threshold in the 30-day Market Value to Realized Value (MVRV) ratio echoes a historical pattern, signaling caution for $BTC traders amidst potential correction phases.
Daily charts indicate a sustained uptrend with diminishing value spikes, hinting at a potential slowdown. Oscillator analysis, including RSI and CCI, suggests caution due to overbought conditions, while MACD signals a complex market situation.
Meanwhile, Bitcoin’s rise, driven by ETF interest, analysts predict new record highs, fueled by decreased outflows in Grayscale Bitcoin Trust and nearly $1 billion in new ETF inflows.
Analysts suggest a significant Bitcoin rally before the halving event in April 2024, advising investors to select preferred companies for potential gains carefully.
Also Read: Bitcoin Nears Trillion-Dollar Milestone Amid ETF Surge