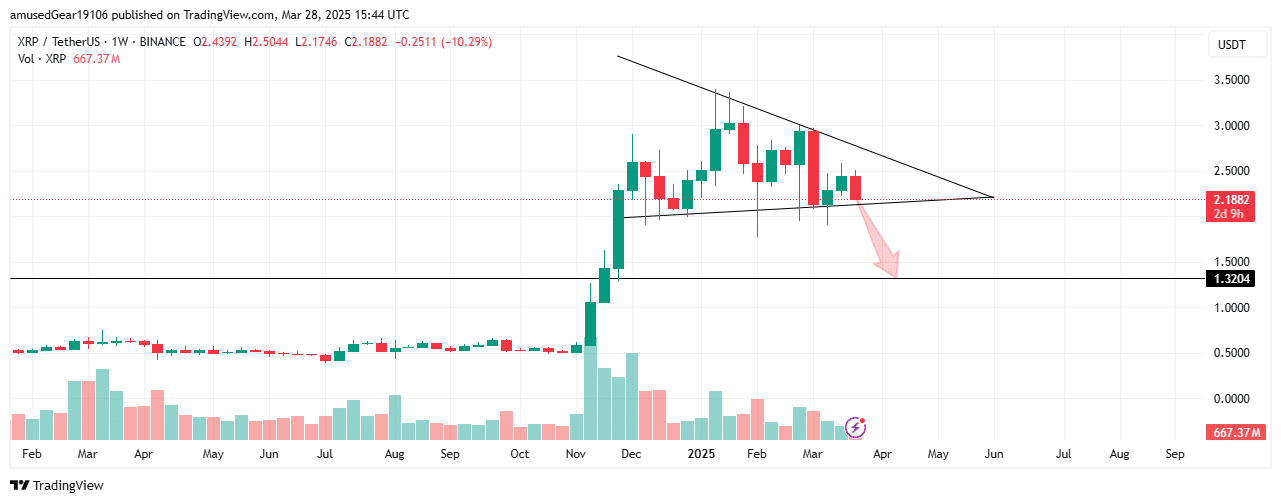
The price of XRP, Ripple’s native cryptocurrency, is declining as its weekly chart shows a descending triangle pattern.
Currently, the pattern is usually bearish, which means XRP may decline further if it goes below a significant support level. Analysts expect a possible fall to about $1.32, down 40% from its current value of $2.17.

Experienced trader Peter Brandt has spotted a head-and-shoulders pattern on XRP’s daily chart, which he believes could push the price down to $1.07.
However, if XRP holds above support and turns, it may surge to $2.55. A breakthrough over this could reverse the downtrend and lead prices back up toward the $3.35 high.
Aside from technical indicators, other economic factors may also affect the price of XRP. One of the biggest concerns is the impending 25% tariffs on automobile imports, which will be implemented on April 3 under the policy of former President Donald Trump. The tariffs are likely to push up manufacturing expenses and consumer prices, adding to inflationary pressures.
The February 2025 Consumer Price Index (CPI) release already reflected a 0.2% month-over-month increase, and the new tariffs are expected to boost inflation by 1.2 percentage points—0.5 points of this through direct effects and 0.7 points through indirect effects.
The Federal Reserve can prolong interest rate cuts as inflation increases, keeping financial conditions tighter. The CME FedWatch Tool estimates the chances of a rate cut in June at 55.7%, down from 67.3% last week.
If the Fed keeps rates higher for longer, it can decrease liquidity in speculative markets, which may negatively impact risk assets such as XRP.
Also Read: XRP Price Expected to Reach $4.48 in 2025: Bitwise


