
Key Highlights
- Ethereum has dropped for three consecutive quarters, marking the first such losing streak in its available quarterly return history.
- Whale addresses holding 1,000 to 10,000 ETH have climbed sharply into the recent weakness, signaling accumulation by large holders.
- ETH is trading near the April 2025 crash support zone, but a close below that level could expose the market to a deeper downside move.
Ethereum is heading into July 2026 under heavy pressure after closing another weak quarter and falling back near a key historical support zone.
ETH was trading near $1,569 on June 30 after slipping more than 2% on the day. The token remains below its short-term moving average near $1,670 and well under the 200-day moving average near $2,294, keeping the broader trend tilted to the downside.
The setup has made July a decisive month for Ethereum. Price weakness, historical quarterly losses and whale accumulation are now moving together, creating a market structure that could either form a base or trigger another leg lower.
Three Red Quarters, a First in Ethereum’s History
Ethereum’s quarterly performance has turned historically weak.
Coinglass quarterly data shows ETH finished Q4 2025 down 28.28%, Q1 2026 down 29.26% and Q2 2026 down 25.43%. That is three losing quarters in a row a streak the asset has not posted once in its trading history dating back to 2016.
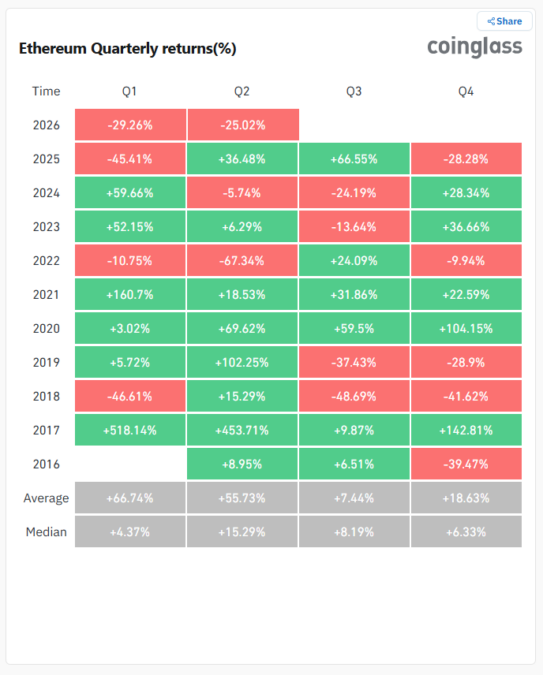
Until now, the worst Ethereum had managed was two consecutive red quarters, most recently in 2024 and during the 2018 bear market. The current run breaks that ceiling. Compounded, the three quarters have stripped roughly 62% off ETH’s value since September 2025.
The streak now carries into Q3, which opened July 1. Historically Q3 has been Ethereum’s least directional quarter, averaging a 7.44% gain with a 8.19% median return across its history, per the same Coinglass table — leaving the live question of whether the quarter breaks the streak or extends it to four.
That makes July more important than a normal rebound month. ETH needs to break the losing structure before traders can treat the move as a durable recovery.
Whales Climb Into the Weakness
While price has fallen, large holders have moved the other way. Glassnode’s whale address count for wallets holding 1,000 to 10,000 ETH has turned higher off its June trough, with the 30-day change reading positive — a pattern that typically signals accumulation rather than distribution.
On-chain flows corroborate it. Roughly 500,000 ETH, worth about $800 million, left exchanges in a single week in mid-June, according to analyst Ali Martinez — coins moving into private wallets usually reduce near-term selling pressure. Corporate treasuries have kept buying through the slump: SharpLink Gaming added 10,000 ETH at an average price near $1,611 on June 30, lifting its holdings above 886,000 ETH, while BitMine Immersion Technologies controls close to 4.7% of circulating supply.
The accumulation sits against capitulation-level sentiment. The crypto Fear & Greed Index read around 13 in late June, deeper in extreme fear than Bitcoin’s — the kind of divergence between price action and large-holder behavior that defines a contested market rather than a settled trend.
$1,500 Is the Line That Matters Now
Ethereum closed June 30 at $1,569 on Coinbase, down 2.56% on the day after trading between $1,547 and $1,612. The price sits below every major moving average, including the 200-day near $2,294, with a death cross intact and the 14-day RSI at 34 — weak, but not yet at the sub-15 capitulation readings seen during June’s sharpest flush.
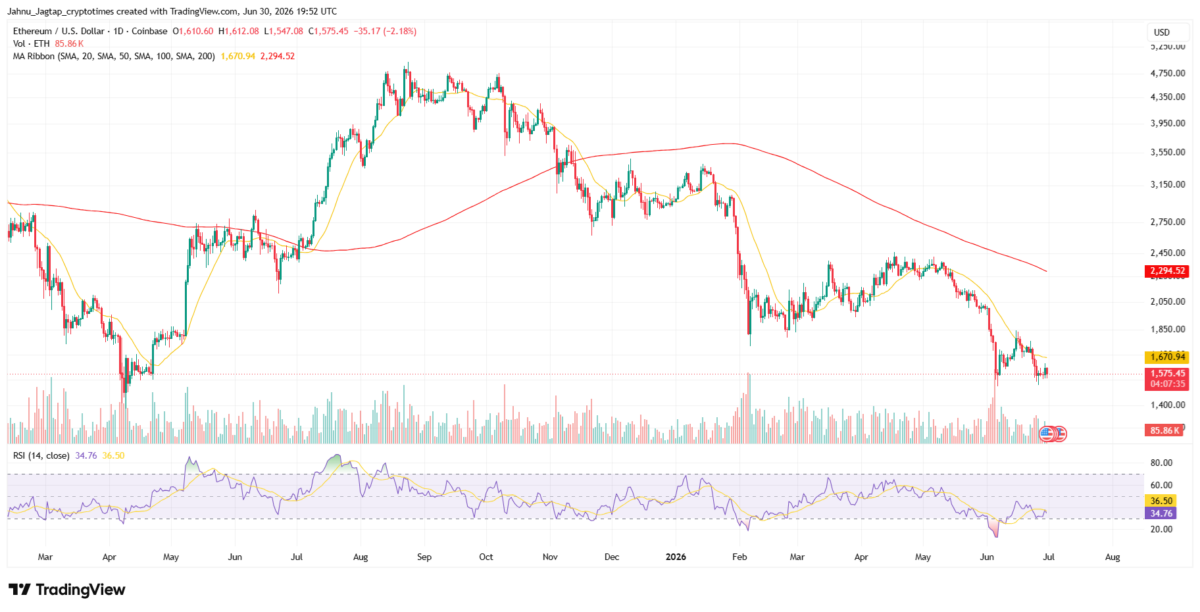
The level that matters is roughly $1,500, the zone ETH last traded in April 2025. It is the last meaningful support on the daily chart before air opens beneath the price. However, the price chart does not yet confirm a bottom. A daily or weekly close below the April 2025 crash support would damage the recovery setup and could open the door for a sharper move lower.
Glamsterdam Is the Quarter’s Swing Factor
The single fundamental catalyst landing inside Q3 is the Glamsterdam upgrade, which developers have targeted for the second half of 2026 after a delay. The hard fork aims to expand the gas limit sharply and lift Layer 1 throughput toward 10,000 transactions per second, Ethereum’s most significant overhaul since The Merge.
No confirmed mainnet activation date has been published, which means the pre-upgrade positioning cycle has not yet opened. A firm date arriving this quarter would give the streak its first genuine counter-catalyst; continued delay narrows that window. Institutional year-end targets remain split — ranging from the low thousands to Standard Chartered’s $7,500 — but those are third-party analyst views, not forecasts, and the chart, for now, still points down.
Why ETH Is Falling Harder Than Bitcoin
The weakness is not market-wide tape alone — Ethereum is the underperformer among the majors. ETH is down roughly 68% from its August 2025 high near $4,950 against Bitcoin’s roughly 52% drawdown.
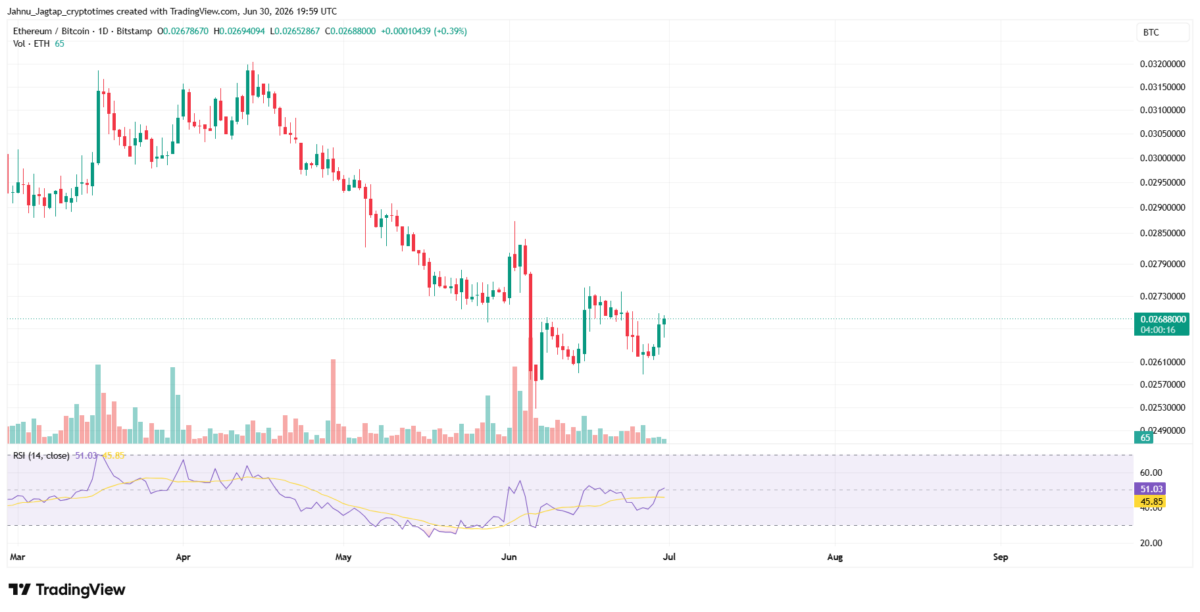
That gap shows up directly in the ETH/BTC ratio. It sits at 0.0269 as of June 30 on Bitstamp, down from about 0.0320 in late March, roughly a 16% slide against Bitcoin in a single quarter — after bottoming near 0.0253 in early June, a multi-year low. The ratio has since clawed back about 6% off that floor, with its 14-day RSI back to a neutral 51, so the relative bleed has paused even as ETH’s dollar price keeps grinding lower.
Institutional flows have stayed against the price. Spot Ethereum ETFs logged a seventh consecutive week of net outflows into late June, with about $273 million withdrawn in the week to June 26 and BlackRock’s ETHA fund accounting for the bulk, per SoSoValue data. Adding to the pressure, the Ethereum Foundation has cut its workforce by 20% and its operating budget by 40%.
The structural overhang is the value-accrual debate: as activity migrates to Layer 2 networks and base-layer fees fall, less ETH is burned, while rivals such as Solana keep capturing on-chain volume — a backdrop that has made Ether a higher-beta bet than Bitcoin throughout the cycle.
What Ethereum Needs in July
July comes down to two levels: the April 2025 support ETH has to hold, and the resistance it has to reclaim to prove the selling is over.
The first hurdle is the 20-day moving average near $1,670, just above the June 30 close of $1,569; reclaiming it would be the first sign short-term sellers are losing their grip. Above that sits a shelf at $1,850, then the $2,050–$2,300 band — capped by the 200-day moving average at $2,294 — which a genuine trend reversal would need to clear.
Until ETH closes back above those markers it remains below every major moving average: a downtrend, not a reversal. The setup cuts both ways — whales are accumulating into the weakness, but price still has to defend its historical floor near $1,500. A failure there would turn the first-ever three-quarter red streak into a far deeper breakdown.
Also Read: SharpLink Adds 10K ETH, Buys Back 2.1M Shares After $75M Raise